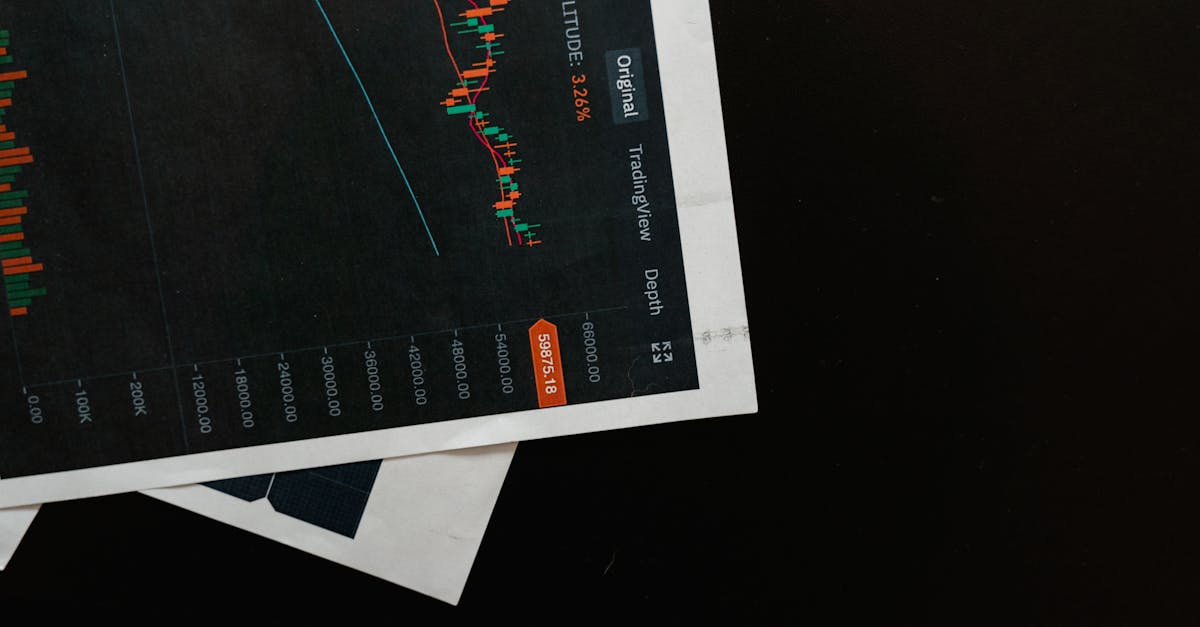
Most investors, especially those focused on growth, dismiss transaction costs. After all, with the rise of commission-free trading, what’s a few cents here or there? In my experience, this mindset is a significant blind spot. It’s not the headline commission fees that sting; it’s the insidious, often hidden, costs that pile up over hundreds or thousands of trades in an actively managed growth portfolio. Specifically, I’m talking about the seemingly trivial $0.50 cost per trade that, when compounded and scaled, can dramatically alter your long-term returns. What seems like pocket change can transform into thousands, even tens of thousands, of dollars in lost capital over a decade, particularly for portfolios engaged in frequent rebalancing, tactical shifts, or concentrated positions. What changed everything for me was a deep dive into the true cost of market access beyond the advertised ‘zero commission.’ Understanding these mechanics shifted my approach from a purely transactional view to a more holistic, cost-aware strategy that prioritizes net gains, not just gross entry and exit prices. The mistake I see most often is underestimating the power of aggregation. A single 50-cent charge is meaningless. A thousand such charges over a year in a $100,000 portfolio? That’s $500. Over ten years, with compounding, the opportunity cost can balloon. This isn’t just about commissions; it includes bid-ask spreads, ECN fees, and even the subtle impact of market orders versus limit orders. These are the details that separate profitable growth strategies from those that quietly underperform.
Key Takeaways
- A seemingly small $0.50 per trade can accumulate into substantial long-term losses for active growth portfolios.
- True trading costs extend beyond commissions to include bid-ask spreads, ECN fees, and the choice between market and limit orders.
- Understanding these granular costs is crucial for optimizing net returns, especially in strategies requiring frequent transactions.
- Shifting to a cost-aware trading strategy, focusing on larger position sizes and fewer, more impactful trades, can significantly improve portfolio performance.
The Illusion of ‘Commission-Free’ Trading
The advent of ‘commission-free’ trading platforms has been a game-changer for retail investors, ostensibly lowering the barrier to entry for active management. However, in my experience, this freedom often comes with hidden costs that are far more detrimental to growth portfolios than a flat $5 or $7 commission ever was. The $0.50 per trade isn’t a direct commission from your broker; it’s a proxy for the aggregate of micro-costs that accrue with every single transaction. Consider the bid-ask spread: the difference between the highest price a buyer is willing to pay (bid) and the lowest price a seller is willing to accept (ask). When you execute a market order, especially for less liquid growth stocks, you’re almost always crossing the spread, effectively paying the seller’s ask price and later selling at the buyer’s bid price. That difference, even if just a few pennies per share, multiplied by hundreds or thousands of shares, adds up. Then there are ECN (Electronic Communication Network) fees, which are often passed on to traders, particularly those who add or remove liquidity. These are usually fractions of a cent per share, but once again, volume turns pennies into dollars.
For a growth investor making 20-30 trades a month, buying and selling, that’s 40-60 legs of transactions. If each leg carries an average implicit cost of $0.50 due to spread and fees, you’re looking at $20-$30 a month, or $240-$360 annually. This might still sound small, but here’s where the real impact comes in: this cost is directly subtracted from your capital, eroding the base on which your future returns compound. It’s like sailing with a constant, tiny leak. You might not notice it day-to-day, but over a long voyage, you lose a significant amount of water. What changed everything for me was realizing that every trade isn’t just about the stock’s performance; it’s a mini-investment decision where the cost of entry and exit must be factored into the expected return. This realization led me to critically evaluate my brokers and their execution quality, opting for those that consistently offered tighter spreads and better fills, even if it meant sacrificing some perceived ‘zero-commission’ benefits.
The Compounding Drain on Your Capital Base
The insidious nature of a $0.50 cost per trade truly reveals itself through compounding. Many growth investors focus solely on percentage gains on their initial investment. If a stock goes up 20%, they celebrate. But if that 20% gain was eroded by 0.5% in trading costs, their net gain is less. Multiply this across an entire portfolio over years, and the impact is profound. Let’s take a hypothetical growth portfolio starting with $50,000. An aggressive growth strategy might involve 100 round-trip trades (buy and sell) per year. At an average of $0.50 cost per trade, that’s $100 in costs per round-trip, or $1000 annually. If this portfolio generates an average annual return of 15% before costs, but consistently loses $1000 to trading costs each year, the actual capital available for compounding is constantly being reduced.
Consider this: over a decade, with a 15% gross annual return, a $50,000 portfolio would theoretically grow to approximately $202,277. However, if $1000 is siphoned off each year by trading costs, the compounding base is smaller every single year. The difference isn’t just $10,000 (10 years * $1000). Because that $1000 wasn’t there to compound, the opportunity cost is far greater. The mistake I see most often is failing to project these small costs over long time horizons. What changed everything for me was building a spreadsheet model that explicitly accounted for these micro-costs. It showed that even a seemingly insignificant $0.50 per leg, over a decade, could reduce the final portfolio value by 5-10% in an active growth strategy. This isn’t just about the money lost; it’s about the wealth never created because that capital was constantly being diluted. This analysis solidified my commitment to minimizing these costs, not just in theory, but in every trade I made.
Rethinking Position Sizing and Trade Frequency
Recognizing the impact of the $0.50 cost per trade forced me to fundamentally re-evaluate my approach to position sizing and trade frequency. The conventional wisdom for new investors often suggests starting with smaller positions to learn the ropes. While there’s merit to that for risk management, it’s also a trap if you’re not factoring in these micro-costs. If a $0.50 cost per trade represents, say, a 0.1% drag on a $500 trade, it’s a 0.01% drag on a $5,000 trade. The smaller your position size, the higher the percentage impact of that fixed $0.50. This means that frequent, small trades, while seemingly safer, are actually the most inefficient way to deploy capital when accounting for these granular costs.
In my experience, what works instead is a more deliberate, less frequent trading style with larger, conviction-weighted positions. Instead of taking small speculative bites out of many stocks, I now focus on identifying high-conviction growth opportunities and allocating more substantial capital to them. This doesn’t mean ignoring diversification, but rather optimizing the execution of diversification. For example, rather than making five $1,000 trades, I’d rather make one $5,000 trade if my conviction is high. The aggregate $0.50 cost is less impactful on the larger sum, leaving more capital to grow. The mistake I see most often is allowing emotions or FOMO (fear of missing out) to drive frequent, small trades, unconsciously chipping away at potential returns. What changed everything for me was adopting a ‘less is more’ philosophy when it came to trade frequency, forcing myself to be more selective and patient, knowing that every trade carried an unavoidable cost, however small it appeared on the surface.
The Strategic Use of Limit Orders
One of the most powerful adjustments I made to combat the $0.50 cost per trade was the disciplined use of limit orders instead of market orders. A market order guarantees execution but does not guarantee price, often forcing you to cross the bid-ask spread and incur those implicit costs. A limit order, on the other hand, guarantees price but does not guarantee execution. For growth investors dealing with less liquid small-cap or mid-cap stocks, this distinction is critical. By placing a limit order, you’re essentially dictating the maximum price you’re willing to pay to buy or the minimum price you’re willing to accept to sell. If your order is filled, it means someone else crossed the spread to meet your price, or the market moved favorably.
In my experience, consistently using limit orders, even when the spread is just a few cents, results in significant savings over hundreds of trades. It requires patience and a willingness to miss out on a trade if your price isn’t met, which can be challenging when chasing rapidly moving growth stocks. However, the long-term benefit of being a ‘price maker’ rather than a ‘price taker’ far outweighs the occasional missed opportunity. The mistake I see most often is investors rushing into market orders, especially during periods of volatility, effectively paying a premium for instant execution. What changed everything for me was recognizing that a few cents saved per share, when multiplied by thousands of shares over time, adds up to real money. It forced me to be more disciplined, planning my entries and exits with greater precision and leveraging the liquidity dynamics of the market to my advantage, rather than passively accepting the costs.
Broker Selection and Execution Quality
The final, and perhaps most critical, piece of the puzzle in minimizing the $0.50 cost per trade is strategic broker selection based on execution quality. Not all ‘commission-free’ brokers are created equal. Many generate revenue through payment for order flow (PFOF), where they route your orders to market makers who pay them for the privilege. While this allows brokers to offer zero commissions, it can also mean your orders are not always executed at the best possible price, effectively costing you through wider spreads or less favorable fills. In my experience, even a fraction of a cent difference per share in execution can easily translate into that $0.50 or more per trade when scaled up to common position sizes.
What works instead is prioritizing brokers with a reputation for superior execution and transparency, even if their headline offering doesn’t scream ‘zero cost.’ Some brokers provide detailed execution reports, showing the average price improvement (or degradation) you receive compared to the National Best Bid and Offer (NBBO). This data is invaluable for an active growth investor. The mistake I see most often is investors choosing a broker based solely on the advertised commission structure, completely overlooking the crucial aspect of execution quality. What changed everything for me was demanding transparency and actively monitoring my fills. I’ve found that some brokers, despite their ‘zero commission’ pitch, consistently offered less favorable fills than others, effectively embedding a hidden cost that far surpassed any historical commission. This led me to consolidate my active trading with a broker that, while still ‘commission-free,’ demonstrated consistent price improvement, ensuring that the implicit $0.50 cost per trade was minimized and my capital was working as hard as possible.
Frequently Asked Questions
What exactly makes up the ‘$0.50 cost per trade’ if commissions are zero?
This $0.50 is an aggregate estimate of implicit costs. It primarily comes from the bid-ask spread, which is the difference between the highest price a buyer is willing to pay and the lowest price a seller will accept. When you place a market order, you often buy at the ask and sell at the bid, effectively ‘paying’ this spread. Additionally, there can be small ECN (Electronic Communication Network) fees and exchange fees that are passed on to traders, though these are typically fractions of a cent per share. For less liquid growth stocks, the spread can be wider, and these micro-fees become more pronounced.
How can I minimize these hidden trading costs?
The most effective strategies include: 1) Using limit orders instead of market orders to control your execution price and avoid crossing wide spreads. 2) Increasing position sizes for each trade, as a fixed cost like the bid-ask spread has a smaller percentage impact on a larger investment. 3) Reducing trade frequency by focusing on higher-conviction opportunities and being more patient. 4) Choosing a broker with superior execution quality and transparency, even if it means slightly higher overall costs in other areas, as better fills can save you more.
Is this $0.50 cost per trade relevant for long-term buy-and-hold investors?
While buy-and-hold investors make far fewer trades, the concept is still relevant. The bid-ask spread is paid on entry and exit. For a long-term investor buying a large block of shares, even a small spread can add up. However, the impact is significantly less severe than for active growth investors making frequent trades, as the costs don’t compound as frequently against the portfolio’s capital base. For them, it’s more of a one-time cost per position.
Does reducing trade frequency compromise my ability to capture growth opportunities?
This is a common concern. In my experience, it often leads to better decision-making. Instead of impulsively chasing every news headline, a commitment to fewer trades forces more rigorous analysis and higher conviction in your selections. You might miss some fleeting opportunities, but you’ll also avoid more costly missteps and allow your chosen growth stocks more time to mature, ultimately leading to a higher net return by avoiding constant cost erosion.
How do I know if my broker offers good execution quality?
Look for brokers that publish execution quality reports or provide data on price improvement. Some brokers will show you how much better your executed price was compared to the National Best Bid and Offer (NBBO) at the time your order was placed. This transparency is a strong indicator of a broker’s commitment to optimizing your trade fills. You can also compare your actual fill prices on trades to the NBBO at the moment of execution, although this requires more effort.
Conclusion
The $0.50 cost per trade, while seemingly insignificant, represents a silent and persistent drain on growth portfolios engaged in active management. Ignoring these granular costs—from bid-ask spreads to ECN fees—is a common pitfall that can significantly erode long-term returns. My experience has shown that a deep understanding of these mechanics, coupled with a strategic shift towards disciplined trading, larger position sizing, and the intelligent use of limit orders, can make a profound difference. Furthermore, prioritizing brokers based on their execution quality, rather than just headline ‘commission-free’ promises, is crucial. For any growth investor aiming to maximize their net returns over the long haul, taking control of these seemingly small costs isn’t just an option; it’s a fundamental requirement for sustained success. Start by analyzing your own trade histories and identifying where these costs are accumulating. The insights you gain will change how you approach every future transaction, moving you closer to true financial growth.